Have you ever wondered why economic decisions often feel like a balancing act? The Phillips Curve mental model helps explain this tension.
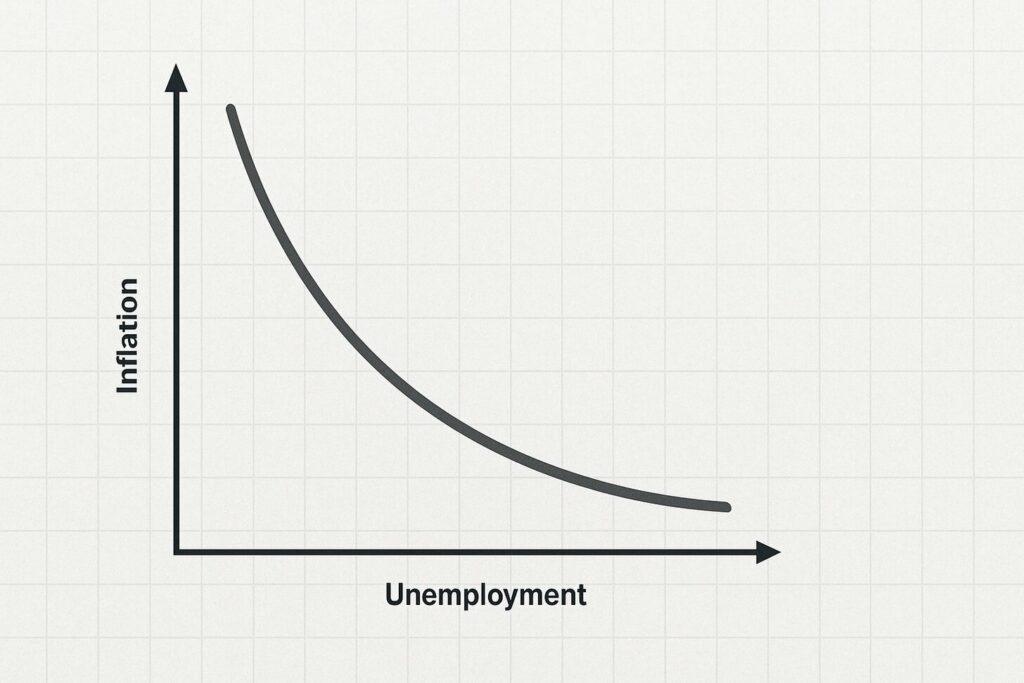
Born from economist William Phillips’ 1950s research, it shows a short-term trade-off: when unemployment drops, inflation tends to rise, and vice versa. Picture a seesaw—pushing one side up inevitably lowers the other.
Originally, this idea guided policies. For example, boosting jobs might mean accepting higher prices. But the 1970s flipped the script. Stagflation—rising unemployment and inflation—broke the pattern.
Why? People’s expectations changed. If consumers and businesses anticipate price hikes, they act in ways that keep inflation stubbornly high.
Today, leaders use this model to weigh risks. Should a company hire rapidly if it risks cost spikes? Can the Federal Reserve cut interest rates without overheating the economy? There’s no free lunch—every choice has a cost.
Key Takeaways
- The Phillips Curve Mental Model highlights a short-term inverse link between joblessness and price increases.
- Historical shifts, like stagflation, proved expectations can reshape outcomes.
- Policymakers use it to balance goals like stable prices and full employment.
- Businesses apply it to navigate hiring, pricing, and growth trade-offs.
- Long-term solutions require adapting to consumer and market behaviors.
Understanding the Phillips Curve Mental Model

What if hiring sprees and price hikes were locked in a tug-of-war? This economic puzzle captivated minds in the 1950s. British economist William Phillips spotted a pattern: when joblessness fell, wages often rose faster. His research revealed an inverse relationship between unemployment and inflation—a discovery later called the Phillips Curve.
From Theory to Reality
Early policymakers treated this Phillips Curve Mental Model like a roadmap. Cut unemployment? Prepare for climbing prices. But the 1970s oil shocks broke the rules of monetary policy.
Prices soared while jobs vanished—a nightmare called stagflation. Workers expected higher costs, so they demanded raises. Businesses hiked prices preemptively.
The expectations gap changed everything, highlighting the effect of the curve on economic change.
Phillips Curve Mental Model: Policy Shifts in Action
Central banks adapted. The Federal Reserve now watches consumer outlooks closely. If people think inflation will jump, it often does—even with stable job numbers. This table shows how strategies evolved:
| Period | Policy Focus | Key Factor |
|---|---|---|
| 1950s-60s | Unemployment-Inflation Trade-off | Labor Market Data |
| 1970s | Price Stability | Oil Prices & Wage Demands |
| Today | Forward Guidance | Public Expectations |
Why does this 70-year-old idea still matter? Because every interest rate decision weighs past lessons. When the Fed adjusts rates, they’re not just reacting—they’re shaping what you expect tomorrow. Ever wonder why gas prices creep up before summer trips? That’s the curve’s legacy in action.
Trade-Offs in Optimizing Employment and Inflation

Imagine a seesaw at a playground—push one side down, the other flies up. That’s how job growth and price stability often interact. When governments or central banks try to boost hiring, they risk sparking price jumps. Cut inflation too hard? Jobs might vanish.
Boosting Employment vs. Fueling Inflation
Let’s say a city funds new infrastructure projects. More workers get hired, wages rise. But soon, lumber and steel costs climb too. Stores charge more as people spend freely. This cycle—described in historical research—shows how good intentions can backfire.
Take the 1960s U.S. tax cuts. Unemployment dropped to 3.8%, but inflation doubled by 1970. Why? More jobs meant more spending power. Factories couldn’t keep up, so prices soared.
| Policy Action | Result | Lesson |
|---|---|---|
| 1960s Tax Cuts | Lower unemployment, higher prices | Growth sparks demand surges |
| 1980s Rate Hikes | Falling inflation, rising joblessness | Quick fixes hurt workers |
| 2020s Stimulus | Mixed inflation-unemployment outcomes | Expectations shape results |
Central banks now walk a tightrope. The Federal Reserve might slowly raise interest rates to cool prices without crushing jobs. Like adjusting a thermostat—too fast, and everyone shivers.
Businesses face similar choices. A tech startup hiring 100 engineers could boost innovation but drain cash reserves. Retailers lowering prices might attract customers—or signal desperation.
Ever notice how solving one problem often creates another? That’s the core tension here. Whether setting interest rates or planning hires, every gain has a cost. No magic fixes—just careful balance.
Real-World Applications Beyond Economics

Ever faced a tough choice between speed and quality? That’s the trade-off mindset in action, much like the principles illustrated by the Phillips curve mental model.
The principles behind balancing competing goals—like jobs and prices, which relate to the natural rate of unemployment—show up everywhere. From startups to school budgets, every decision has hidden costs, influenced by inflation expectations.
Business and Project Management Insights
Imagine launching a product. Rush it to market, and you risk bugs. Delay for perfection, and competitors might steal your spotlight. This tension mirrors economic trade-offs. Teams often juggle timelines, costs, and scope—pick two, lose one.
Software projects face similar dilemmas. Adding features could push deadlines. Cutting corners might frustrate users. One study found 60% of projects exceed budgets when teams ignore these balances. Sound familiar?
| Scenario | Trade-Off | Outcome |
|---|---|---|
| Fast product launch | Quality vs. Speed | Higher returns, but potential recalls |
| Expanding to new markets | Growth vs. Risk | Revenue gains, but cultural missteps |
| Hiring senior talent | Expertise vs. Cost | Better decisions, slower payroll growth |
Leadership and Strategic Decision-Making

Leaders face their own version of the inflation-unemployment dance. Should a CEO invest in employee training or new tech? Training boosts skills but delays innovation. New tools might widen the gap between teams.
Consider a hospital administrator. Hiring more nurses improves care but strains budgets. Reducing staff keeps costs low but risks patient satisfaction. There’s no perfect answer—just informed choices.
How do you navigate these crossroads? Start by naming the trade-offs. Use probabilistic thinking to weigh risks. Ask: “What’s the cost of being wrong?” Sometimes, slow and steady wins the race.
Can we balance goals without compromise? Rarely. But clarity about priorities turns economic theory into daily wisdom. Next time you face two good options, remember: every “yes” quietly says “no” to something else.
Monetary Policy and Inflation Dynamics

What happens when central banks adjust interest rates? Think of it as adjusting a car’s speed while navigating fog—too fast, and you risk crashing. The Federal Reserve uses tools like rate changes to steer inflation toward its 2% target. This approach leans on the historical relationship between job markets and price stability.
In 2022, the Fed raised rates seven times to cool soaring prices. Markets reacted instantly—mortgage rates jumped, and tech stocks dipped. Why? Investors feared higher borrowing costs would slow spending. But unemployment stayed low, challenging old assumptions about the trade-off between inflation and jobs.
Policy Measures and Market Reactions
Central banks now focus heavily on public expectations. If people believe prices will rise, they might demand higher wages—creating a self-fulfilling cycle. The Fed uses speeches and forecasts to shape these views. For example, hinting at future rate hikes can sometimes calm markets without immediate action.
Recent data shows the link between unemployment and inflation has weakened. Some call this a “flattening” trend. Even with strong labor markets, price jumps are less dramatic. Globalization and tech advances might explain why. Companies can now source cheaper materials overseas or automate tasks.
How does this affect your wallet? When the Fed tightens policy, credit card rates climb. Savers earn more on deposits, but homebuyers face steeper loans. Ever notice gas prices dip after a rate announcement? Markets respond to hints like weathervanes in a storm.
Empirical Data and Economic Research

What happens when real-world data clashes with decades-old theories like the Phillips curve? The 1970s stagflation crisis delivered a wake-up call.
Unemployment and inflation rose together, defying traditional patterns and challenging the natural rate of unemployment. Researchers scrambled to explain why the rules had changed, particularly regarding inflation expectations and the slope of the Phillips curve.
Stagflation and the Flattening Trend
Stagflation smashed the original curve’s predictions. Between 1973 and 1982, U.S. inflation hit 14% while joblessness climbed to 10.8%. Workers demanded raises as prices spiraled, creating a feedback loop. This expectations gap reshaped economic models.
Modern studies show a “flattening” trend—the link between jobs and prices has weakened. From 1990 to 2019, unemployment dropped to 3.5%, yet inflation stayed below 3%. Why? Globalization and automation reduced labor’s pricing power. The table below highlights key shifts:
| Period | Unemployment Rate | Inflation Rate | Slope |
|---|---|---|---|
| 1960s | 3.8% | 4.7% | Steep |
| 1980s | 7.5% | 6.1% | Moderate |
| 2010s | 4.9% | 1.8% | Flat |
Role of Public Expectations and Economic Slack
Your beliefs about prices matter more than ever. If families expect 5% inflation next year, they’ll push for bigger raises. Businesses then hike prices to cover costs—a self-fulfilling cycle. Federal Reserve Bank research found expectations now drive 60% of inflation moves.
Economic slack—like unused factory capacity—once cooled price jumps. Today, even with idle resources, inflation persists. Why? Companies prioritize stable margins over market share. Imagine a bakery raising bread prices despite empty tables—that’s modern inflation dynamics.
So what’s the takeaway? Old models still offer clues, but real data demands fresh thinking. As one economist quipped, “The curve isn’t broken—it’s just wearing new clothes.”
The Phillips Curve Mental Model in Practice

How do leaders make tough calls when every choice has consequences? Modern policymakers use data-driven approaches to navigate the delicate balance between jobs and price stability. Let’s explore how historical lessons shape today’s decisions.
Policy Choices Through the Decades
In the 1960s, tax cuts boosted hiring but triggered price surges. Fast-forward to 2023: similar stimulus efforts led to mixed results. Why? Global supply chains and remote work altered traditional patterns. The natural rate of unemployment—once seen as fixed—now shifts with tech advances and worker preferences.
| Period | Action | Outcome |
|---|---|---|
| 1979 | Aggressive rate hikes | Inflation fell from 13% to 3% in 3 years |
| 2021 | Stimulus checks | Prices rose 7%, but jobs rebounded fast |
Today’s Data-Driven Balancing Act
Central banks now track economic slack—like unused factory capacity—to predict price moves. If a bakery operates at half-speed but raises bread costs, it signals changed priorities. The Federal Reserve Bank watches these clues closely.
Public expectations play a bigger role than ever. When families anticipate higher costs, they spend faster—fueling inflation. Recent surveys show 68% of Americans expect prices to keep climbing. This belief alone can make it reality.
Does history repeat itself? Compare 1970s oil shocks to 2022’s energy crunch. Both periods saw squeezed budgets and anxious consumers. Yet today’s policy measures adapt faster, using real-time data streams.
Every decision requires weighing risks. Should we prioritize jobs today if it means higher prices tomorrow? There’s no universal answer—just informed trade-offs. How would you balance these competing goals?
Advanced Theories on Inflation
How do your spending habits shape the economy? Theories like Fisherian intuition reveal hidden connections between everyday choices and price trends. Let’s unpack two powerful ideas that explain modern inflation puzzles.
Interest Rates, Fisherian Intuition, and Price Dynamics
Imagine borrowing $100 at a 5% rate. If inflation hits 3%, your real cost is just 2%. This “Fisher equation” (nominal rate ≈ real rate + inflation) guides central banks. When the Federal Reserve hikes rates, they’re not just making loans pricier—they’re shaping what you expect tomorrow.
In 2023, Chair Powell noted: “Policy works through expectations.” A 0.25% rate increase can cool spending if people believe more hikes follow. It’s like turning a dial slowly—too fast, and the engine stalls.
Adaptive versus Rational Expectations
Do you assume next year’s prices will mirror last year’s? That’s adaptive thinking. Rational forecasters dig deeper—studying Fed speeches or job data. See the difference:
| Expectation Type | Basis | Example |
|---|---|---|
| Adaptive | Past trends | Expecting 5% inflation because last year hit 5% |
| Rational | All available data | Predicting rate cuts after unemployment rises |
The 1970s saw adaptive thinking dominate. Today, tools like real-time wage trackers help businesses stay ahead. When Walmart adjusts prices weekly, they’re playing the rational game.
How do your expectations shape decisions? If you rush to buy a car fearing price jumps, you’re fueling the very trend you dread. Theory isn’t just for economists—it’s in your grocery cart.
Conclusion
Why do smart choices often feel like walking a tightrope? The push-pull between goals—like jobs and prices—shapes decisions from boardrooms to kitchen tables. History shows quick fixes rarely work. When policymakers cut unemployment too fast, inflation often follows. But crushing prices too hard can stall hiring.
Modern leaders use lessons from past crises. The Federal Reserve now weighs consumer expectations as heavily as raw data. If families brace for price jumps, they spend differently—creating ripple effects. Businesses face similar tensions: hire rapidly or risk falling behind?
There’s no perfect formula. Central banks adjust interest rates like dimmer switches—too bright or too dark, and nobody’s happy. Companies balance growth with stability, knowing every gain has a cost. Even your grocery budget reflects these trade-offs.
What’s the takeaway? Complex systems demand flexible thinking. Whether managing a team or a nation, clarity about priorities matters most. How will you navigate your next tough choice when every option carries risk?