Have you ever wondered why good times can suddenly turn into economic chaos? The Minsky Moment mental model explains this paradox. It shows how long periods of stability often trick people into taking bigger risks—until debt piles up and markets crash. Think of it like a game of Jenga: the higher the tower grows, the more likely it is to collapse.
This idea comes from economist Hyman Minsky’s financial instability hypothesis. He argued that calm markets make investors overconfident. They borrow more money, assuming prices will keep rising. But when reality hits—like during the 2008 housing crash or the dotcom bubble—the system snaps, and panic spreads.
You don’t need a finance degree to see this pattern. Businesses, families, and even governments fall into the same trap. When things feel safe, we take on loans, expand quickly, or ignore warning signs. But as Minsky warned, stability itself can become a risk. The longer the boom, the harder the bust.
In this article, we’ll break down how debt, markets, and human behavior create these cycles. You’ll learn to spot the warning signs—and maybe avoid getting caught in the next crisis.
Key Takeaways
- Economic calm often hides growing risks as people take on more debt.
- Markets crash when borrowers can’t repay loans, creating a domino effect.
- Historical examples include the 2008 recession and 2000 dotcom collapse.
- Stability encourages risk-taking, which eventually backfires.
- Understanding these patterns helps in business and personal finance.
Minsky’s Financial Instability Hypothesis
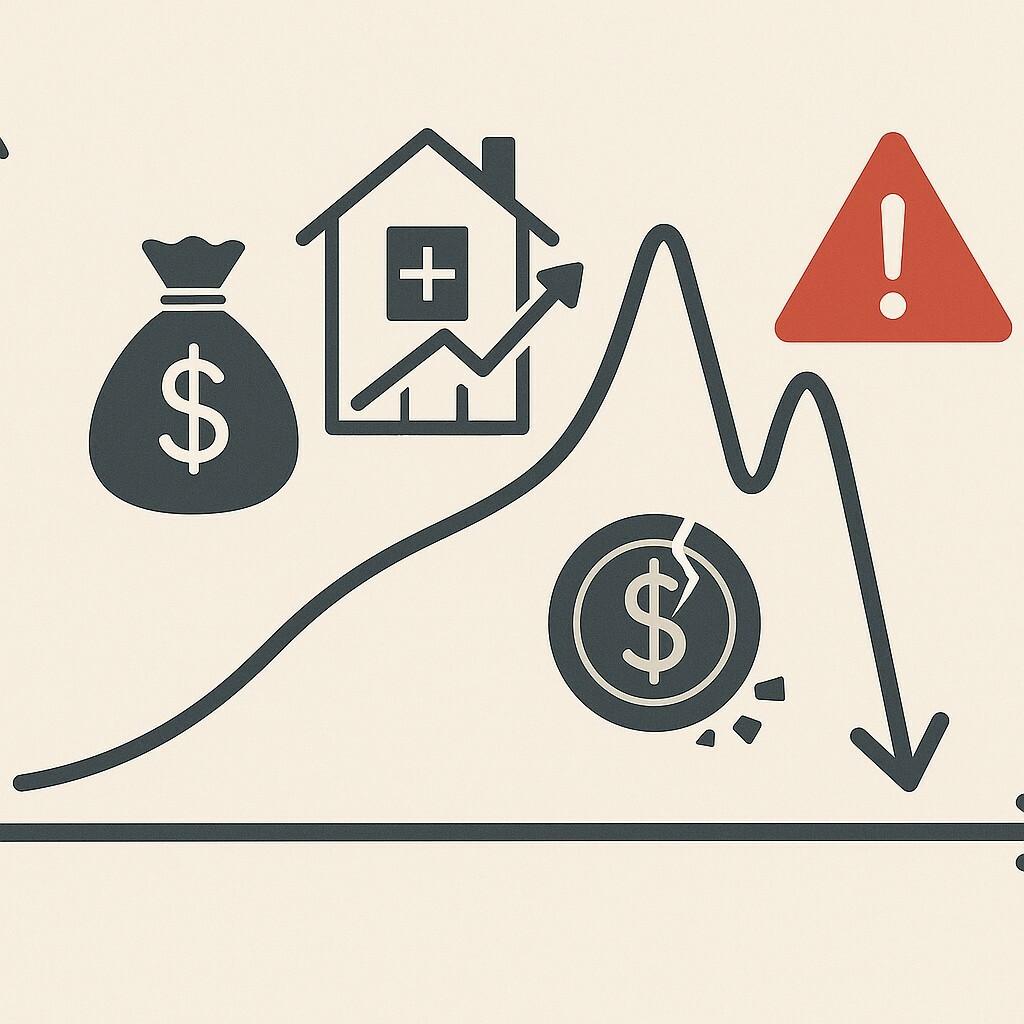
Why do calm markets sometimes crash without warning? Economist Hyman Minsky spent his career answering this question. His financial instability hypothesis flipped traditional economics on its head. While others assumed markets naturally balanced themselves, Minsky argued stability breeds recklessness.
Classical thinkers believed debt and risk stayed under control. But Minsky saw something different. When times are good, investors borrow more. Companies expand. Families take bigger loans. Everyone assumes prices will keep rising. This creates a dangerous cycle of overconfidence.
| Aspect | Classical Economics | Minsky’s View |
|---|---|---|
| Market Stability | Self-correcting | Inherently unstable |
| Risk Perception | Rational | Grows during calm periods |
| Role of Debt | Neutral | Fuels speculative bubbles |
Did you know that safe times can hide big risks? The 2008 housing crash proved Minsky right. Banks lent freely, assuming home values would never fall. When loans defaulted, the whole system cracked. The same pattern appeared in the 2000 dotcom bust—too much credit chasing unrealistic tech dreams.
Central banks now watch debt levels closely. But Minsky’s ideas aren’t just for policymakers. Everyday choices matter too. Taking a mortgage? Starting a business? His theory reminds us: long booms often end badly. In the next sections, we’ll explore how to spot these traps before they snap shut.
Economic Cycles and Market Instability
How does prosperity plant the seeds of its own downfall? Boom-bust cycles describe this pattern: economies grow rapidly, optimism spreads, then everything collapses. Like a balloon inflating until it pops, good times often hide growing risks.
Minsky Moment Mental Model and Boom-Bust Dynamics
During a boom, people borrow more. Families take bigger mortgages. Companies expand using credit. But debt piles up quietly—until someone can’t pay. Remember the 2020 tech stock surge? Prices soared, then dropped 30% in weeks. Markets swing from “everything’s perfect” to “sell now!”
Classical Versus Minsky’s Perspective
Old-school economists believed markets self-correct. Minsky disagreed. He saw stability as a trap. The longer things stay calm, the more investors gamble. Compare the views:
| Factor | Classical Theory | Minsky’s Insight |
|---|---|---|
| Debt Levels | Manageable | Fuel instability |
| Risk Perception | Stable | Grows during booms |
| Market Behavior | Predictable | Prone to panic |
Ever seen a “hot” housing market crash? That’s the cycle in action. Borrowers assume prices will rise forever—until they don’t. Next, we’ll explore how asset prices and leverage turn optimism into crisis.
Role of Debt, Risk-Taking, and Asset Prices
What happens when borrowing feels like free money? Easy credit and low interest rates often kickstart a dangerous cycle. People take bigger loans, banks relax standards, and prices climb—until the bubble bursts.
How Debt and Leverage Contribute to Instability
Imagine buying a house with 5% down. If prices rise, you win big. But if they drop? You owe more than it’s worth. This leverage magnifies gains and losses. During the 2006 housing boom, relaxed lending rules let borrowers take on risky mortgages. When defaults began, the whole system trembled.
| Who’s Involved? | Role in Crisis |
|---|---|
| Lenders | Offer easy credit, lower standards |
| Investors | Chase high returns, ignore risks |
Asset Price Bubbles and Investor Behavior
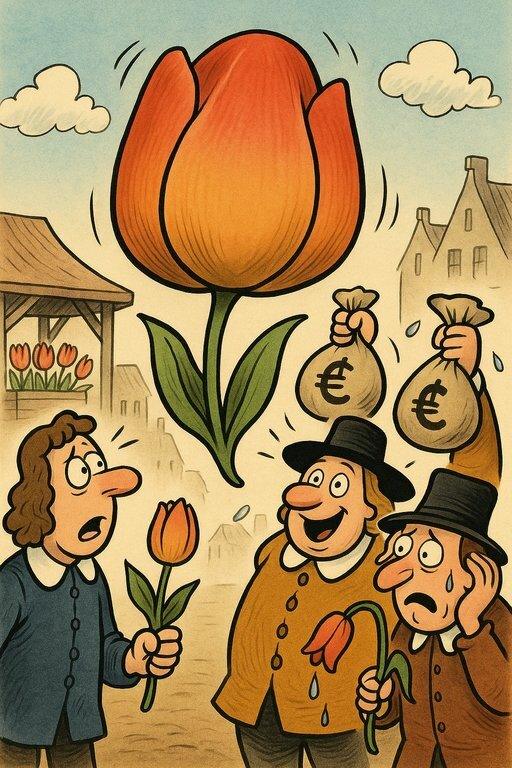
Why did tulips once cost more than houses? When optimism peaks, logic fades. Stocks, homes, or crypto—prices detach from reality. Fear of missing out (FOMO) pushes people to buy at any cost. Remember GameStop’s 2021 rollercoaster? Speculation trumped fundamentals.
Low interest rates fuel this fire. Cheap money flows into risky bets, creating artificial demand. But when rates rise or loans default, the crisis begins. Like a game of musical chairs, someone gets left holding worthless assets.
Managing debt psychology is key. Borrowers and lenders both shape the economy’s stability. Next, we’ll explore how to spot these patterns before they spiral.
Exploring The Minsky Moment Mental Model

Ever felt confident just before everything changed? The Minsky Moment mental model describes that exact tipping point. It’s when years of rising debt and calm markets suddenly flip into panic—like a dam breaking after too much pressure, leading to a potential financial crisis.
Here’s how it works. Over time, people and businesses borrow more, assuming good conditions will last. Banks approve riskier loans, and asset prices climb.
But eventually, someone can’t pay—a mortgage defaults, a company misses a payment. That small crack triggers a chain reaction, often resulting in broader financial crises that central banks and governments struggle to manage.
Take Sarah, a bakery owner. She expanded using credit during a 5-year boom. When ingredient costs spiked, her profits vanished. Debt payments piled up, forcing her to close.
Like Sarah, entire markets often ignore creeping risks until it’s too late, highlighting the concept of Minsky financial instability in investment practices.
| Warning Signs | Smart Moves |
|---|---|
| Rising personal/corporate debt | Limit borrowing to what you can repay |
| “Everyone’s getting rich” mindset | Diversify investments |
Why do we miss these red flags? Optimism blinds us. We think, “This time is different,” or “I’ll handle it later.” But as history shows, debt-fueled growth rarely ends smoothly.
Simple ideas matter here. Track your loans. Save during good years. Ask: “What if prices drop 20%?” These steps won’t stop global crises, but they’ll shield you personally. Later, we’ll share actionable ways to spot—and avoid—these traps.
Phases of Minsky’s Credit Cycle: Hedge, Speculative, and Ponzi

Imagine building a tower block by block—each layer riskier than the last. That’s how credit cycles work. They start with careful planning but often end in reckless bets. Let’s break down the three stages that turn steady growth into chaos.
Defining the Three Financing Stages
Hedge financing is like buying a home with a fixed-rate mortgage. Borrowers can pay both interest and principal from their income. It’s safe—like using a ladder to reach a shelf. Businesses here focus on steady profits, not speculation.
Speculative financing steps onto thinner ice. Imagine a landlord relying on rent hikes to cover mortgage payments. They can pay interest now but need refinancing later. If rents stall, trouble begins.
Ponzi financing is pure gamble. Borrowers can’t cover interest or principal—they bet on asset prices rising forever. Think crypto buyers in 2021 hoping to flip coins for profit. When prices drop, defaults snowball.
| Stage | Risk Level | Real-World Example |
|---|---|---|
| Hedge | Low | Fixed-rate business loans |
| Speculative | Medium | Adjustable-rate mortgages |
| Ponzi | High | Buying meme stocks on margin |
Spotting the Shift Between Stages
How do markets slide from safe to shaky? Watch for rising debt ratios and relaxed lending rules. In 2006, banks offered “no-doc” loans—no income checks! Central banks track these signs, but individuals can too.
Ever maxed a credit card, then applied for another? That’s personal Ponzi behavior. Markets work the same. When refinancing replaces real repayment, instability grows. Can you see how moving from safe to risky credit changes everything?
Smart investors diversify and limit leverage. Families budget for rate hikes. These steps won’t stop crashes, but they’ll keep your tower standing when others fall.
Case Studies and Real-World Examples

Looking back, what can past market crashes teach us? Two events—the 2000 dotcom bust and 2008 housing collapse—show how calm markets spiral into chaos. Both started with soaring asset prices and ended with trillions lost. Let’s unpack why these patterns repeat.
Lessons from the Dotcom Bust and 2008 Crisis
In the late 1990s, tech stocks became a frenzy. Companies with no profits saw valuations explode. By 2000, the Nasdaq hit 5,000—then dropped 78% in 30 months. Why? Investors borrowed heavily, betting on endless growth. When earnings disappointed, debt turned toxic.
Eight years later, housing followed the same script. Banks handed mortgages to buyers with shaky incomes. Home prices kept rising—until they didn’t. By 2009, 10 million Americans faced foreclosure. The crash wiped out $16 trillion in wealth.
| Crisis | Debt Trigger | Liquidity Freeze |
|---|---|---|
| Dotcom Bust | Margin loans for stocks | Tech funding vanished |
| 2008 Collapse | Subprime mortgages | Banks stopped lending |
Notice the pattern? Easy investments during good times become traps. When defaults rise, liquidity dries up. Markets go from “buy everything” to “sell now!” within months.
Have you ever wondered why these cycles feel familiar? Human nature plays a part. We chase trends, ignore risks, and assume someone else will handle the fallout. But as history shows, stability often hides the next crisis.
What’s the takeaway? Track debt levels—yours and the economy’s. Diversify before bubbles pop. And remember: today’s “sure thing” could be tomorrow’s lesson.
Insights Versus Mathematical Modeling

Do numbers always tell the full story? Hyman Minsky thought words could reveal truths that equations miss. His work focused on qualitative ideas—like how confidence shifts during calm years—rather than complex formulas. While modern economists rely on algorithms, Minsky’s instability hypothesis used real-world patterns to predict crises.
Why Stories Outperformed Spreadsheets
Minsky warned about debt-fueled collapses decades before 2008. How? He studied human behavior, not just spreadsheets. His ideas highlighted how lenders grow careless when risks seem low. Math models often miss these psychological shifts—like assuming people always act rationally.
When Data Fails to Capture Reality
Modern economics uses AI to forecast trends. But can machines predict panic? During the 2020 market crash, algorithms misread investor fear. Human narratives explained the chaos better than volatility indexes.
| Aspect | Qualitative Approach | Quantitative Models |
|---|---|---|
| Focus | Behavior patterns | Statistical trends |
| Tools | Case studies, interviews | Big data, algorithms |
| Strengths | Explains “why” | Measures “how much” |
| Weaknesses | Hard to generalize | Misses human factors |
Think of it like weather forecasting. Satellites track storms (data), but locals know flood risks (stories). Both matter. Minsky’s work reminds us: simple hypotheses about greed and fear often spot trouble first. Next time you see a “perfect” economic chart, ask: what’s the story behind the numbers?
International Markets and Policy Influences

Ever notice how a sneeze in one country can start a cold elsewhere? Global markets work the same way. Choices made in Beijing or Brussels ripple through local jobs, home prices, and grocery bills. Let’s explore how central banks and far-off policies shape your wallet.
The Quiet Power of Central Banks
When the U.S. Federal Reserve adjusts interest rates, it’s not just about American loans. Lower rates send investors hunting for better returns worldwide. Money flows into emerging markets, pushing up asset prices—until rates rise again. Suddenly, that cash vanishes, leaving economies shaky.
Take China’s bank lending spree after 2008. To boost growth, banks poured money into infrastructure projects. Cities sprouted highways and empty apartments. But when loans went bad, the destruction spread. Global copper prices crashed. Australian miners laid off workers. Brazilian towns lost export income.
| Central Bank Action | Immediate Effect | Long-Term Risk |
|---|---|---|
| Cut interest rates | Cheaper loans | Debt buildup |
| Buy government bonds | More cash in markets | Asset bubbles |
Your Grocery Bill, Their Policy
Why care about Chinese banks if you’re in Kansas? Because policies abroad shape your economy. When Europe’s energy costs soared in 2022, U.S. fertilizer prices doubled. Farmers paid more, so your bread costs rose. Everything’s connected.
Smart moves? Watch central banks’ meetings—they’re free on YouTube. Notice when countries like Japan defend their currency. Ask: “Could cheaper imports hurt local factories?” These clues help spot financial instability before it hits home.
Investor Strategies From Minsky’s Theories

What if your safest investments hid the biggest risks? Minsky’s ideas teach us to prepare for sudden shifts. When markets feel unstoppable, smart moves today can prevent panic tomorrow.
Building a Margin of Safety
Cash is king during a crisis. Experts suggest keeping 6-12 months’ expenses in savings. Why? When stocks plunge or jobs vanish, liquidity lets you wait out the storm. Quality bonds add stability—they rarely crash with stocks.
Take 2020’s tech stock frenzy. Investors piled into soaring shares. But those holding cash bought discounts when prices dropped 30%. Like an umbrella in sunny weather, reserves seem unnecessary—until the downpour hits.
Navigating Market Euphoria and Panic
Ever seen friends brag about “easy money” trades? That’s euphoria. Investors often chase trends, ignoring risks. In 2021, crypto mania saw Bitcoin hit $69,000. Six months later, it fell to $29,000. Staying grounded matters.
| Strategy | Calm Markets | Crisis Period |
|---|---|---|
| Cash Reserves | Build savings slowly | Use funds to buy low |
| Bond Allocation | 20% portfolio | Increase to 30-40% |
| Avoid Trends | Skip overhyped stocks | Focus on essentials |
What steps can you take when everyone’s buying recklessly? First, check your credit exposure. High debt magnifies losses. Second, diversify across assets—real estate, stocks, bonds. Third, ignore the crowd. As one trader said, “Be fearful when others are greedy.”
Even business leaders use these rules. Apple keeps $166 billion cash to handle surprises. You don’t need billions—just a plan. Next time markets soar, ask: “What’s my exit strategy?”
Policy and Economic Stability Measures

Can we trust a calm market to stay stable forever? History says no—but smart policies can soften the blow. After the 2008 crisis, regulators began using ideas from economic theory to spot risks early. They now track debt growth, test banks’ resilience, and limit reckless lending.
Central banks play firefighter during crashes. In 2020, the Fed slashed interest rates and bought bonds to keep money flowing. This “lifeline” helped businesses survive lockdowns. But prevention matters too. Rules like stress tests force banks to plan for disasters before they strike.
| Reactive Policies | Proactive Measures |
|---|---|
| Bailouts during crises | Debt-to-income limits |
| Emergency rate cuts | Bank capital requirements |
| Stimulus checks | Real estate speculation taxes |
What’s your role in this system? Investors can pressure firms to avoid risky debt. Families might choose fixed-rate mortgages over adjustable ones. Small steps add up—like saving during boom years to cushion downturns.
Governments and central banks aren’t perfect, but they’ve learned from past mistakes. The 2008 meltdown led to stricter oversight. COVID-19 responses showed targeted aid works better than blanket checks. By mixing theory with real-world tools, we build an economy that bends but doesn’t break.
Ready to see how these lessons apply to your choices? Our final section ties everything together—with actionable steps to stay safe in shaky times.
Conclusion
Why do smart choices today prevent disasters tomorrow? Understanding how debt and confidence shape markets helps everyone—from families to CEOs. When money flows easily, risks hide in plain sight. But over time, unchecked borrowing turns calm waters into a perfect storm.
History shows a clear pattern: stable economics breed complacency. People take bigger loans, asset prices inflate, and lenders ignore red flags. Then one default—a job loss or rate hike—triggers a chain reaction. The 2008 crash and dotcom bust followed this script.
Simple steps matter. Track your debts. Save during good years. Ask, “What if my home’s value drops?” These habits build resilience against sudden shifts. Even watching financial news helps spot trouble early.
Don’t you feel more prepared now? Knowledge is power. By learning from past crises, we make wiser choices with our cash and careers. Stay curious, watch the trends, and remember: calm seas don’t guarantee smooth sailing forever.


